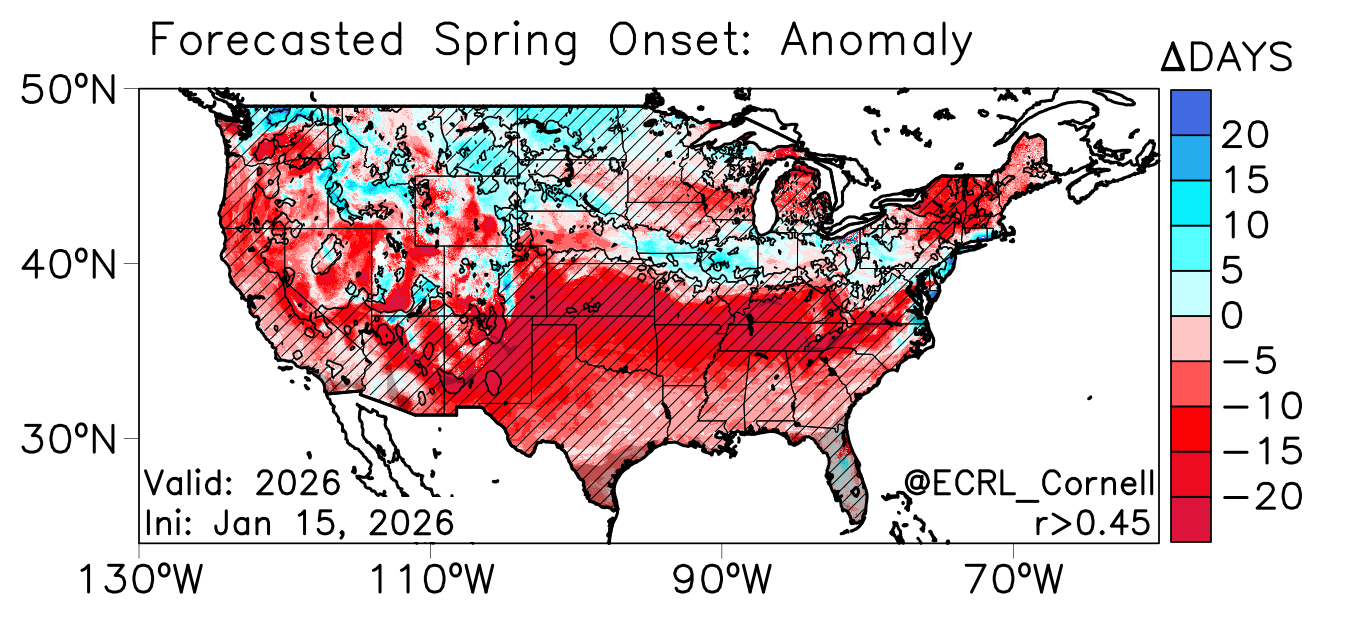
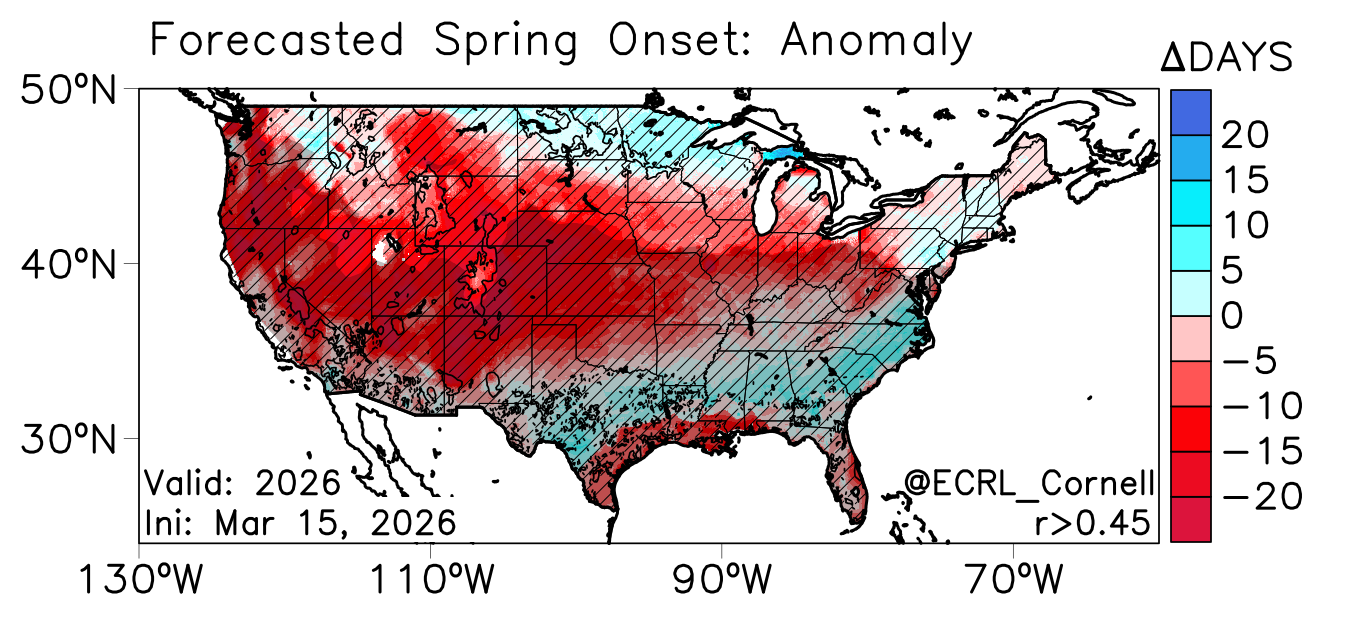
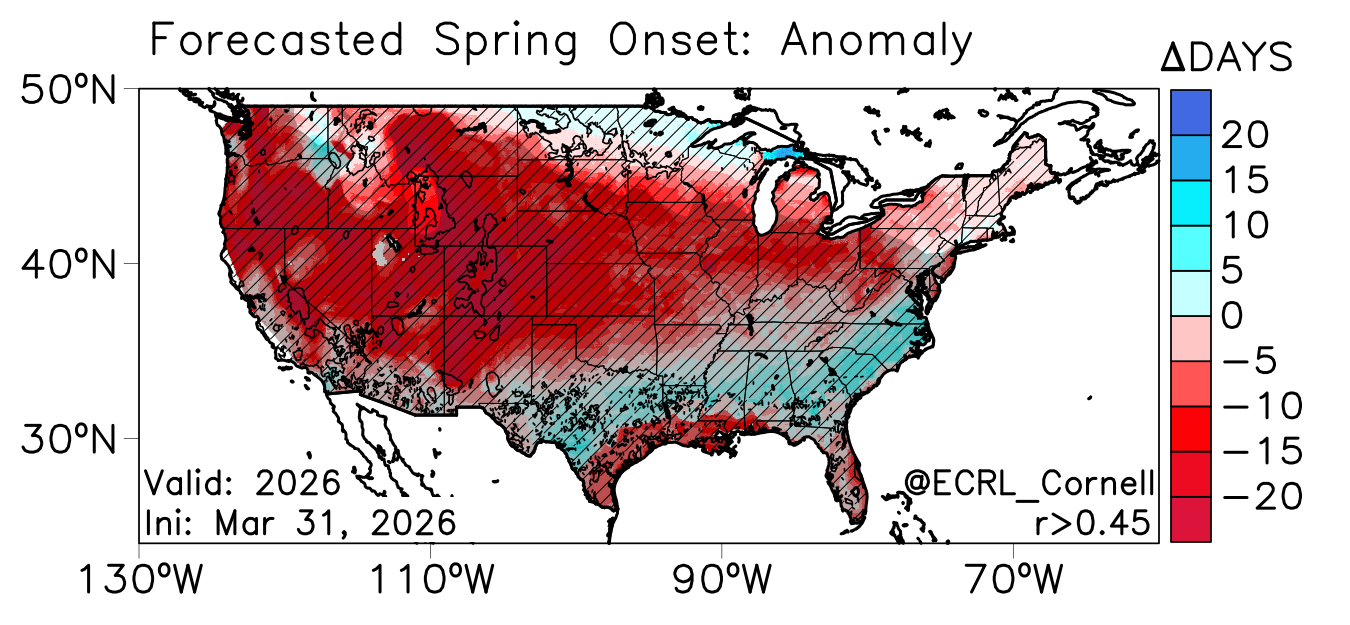
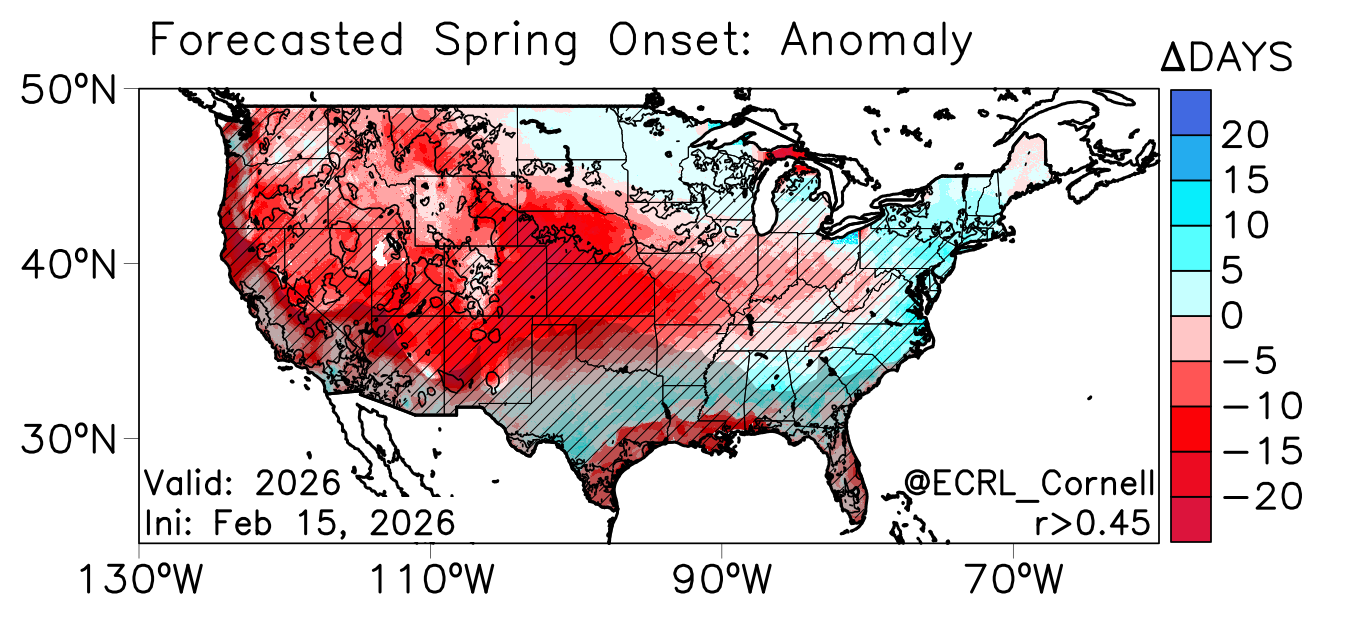
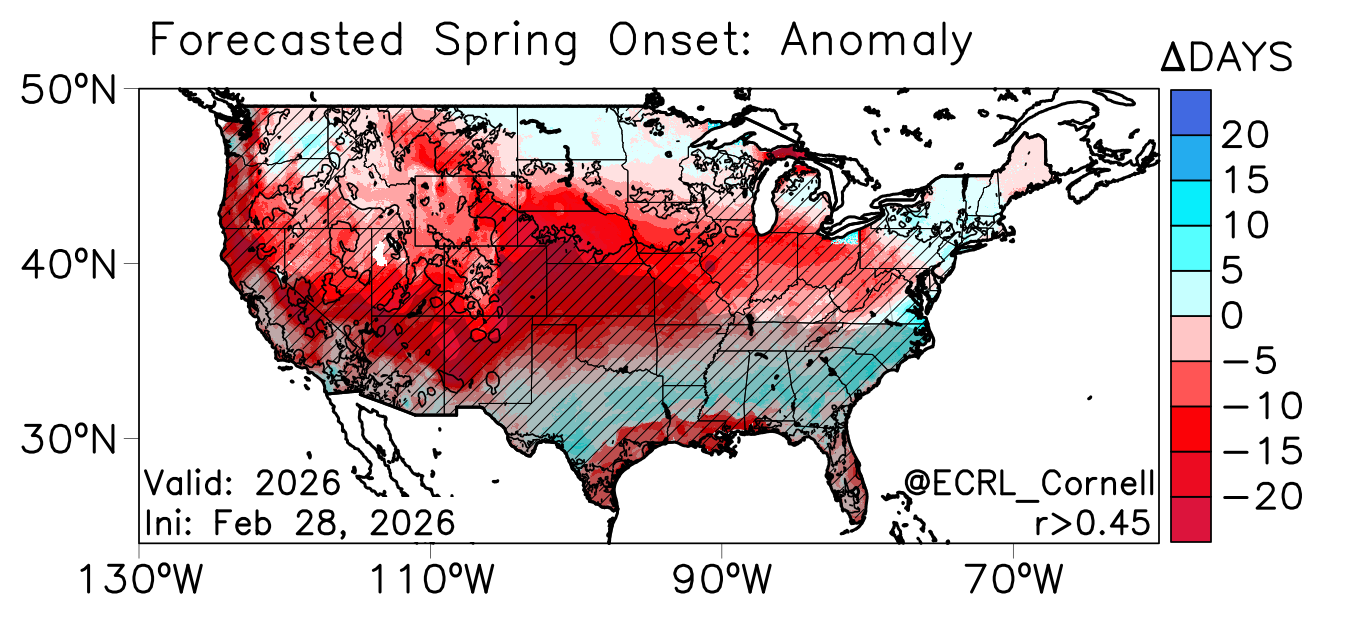
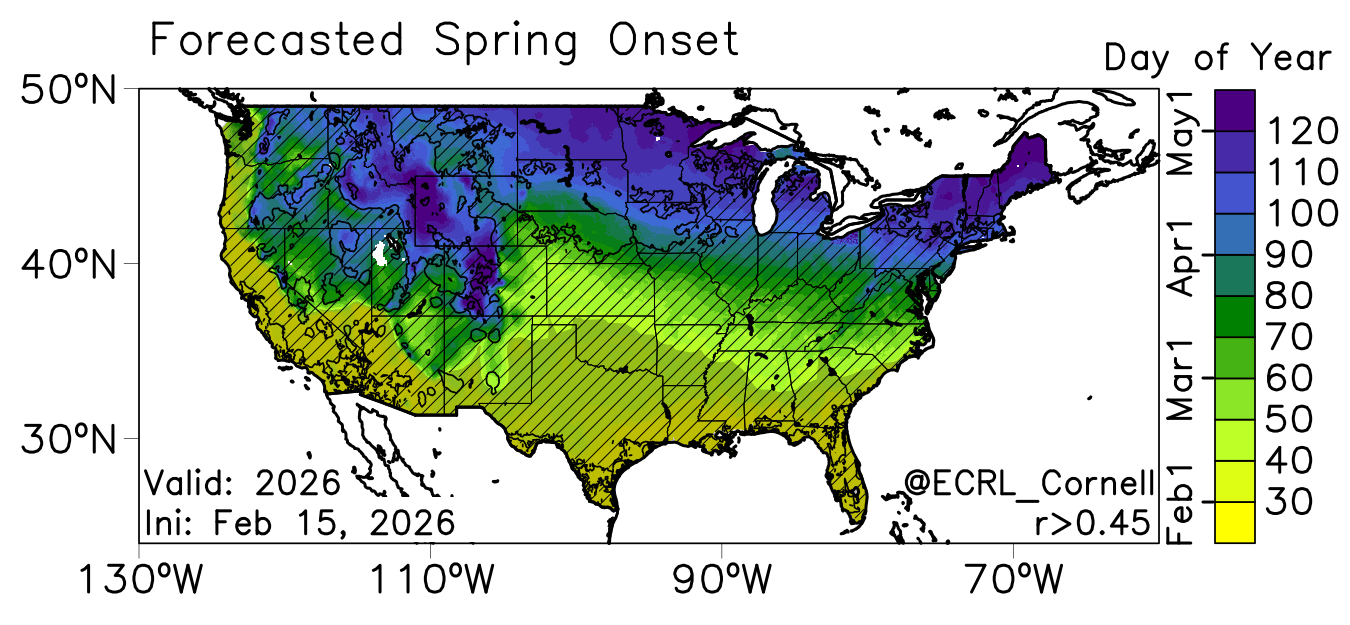
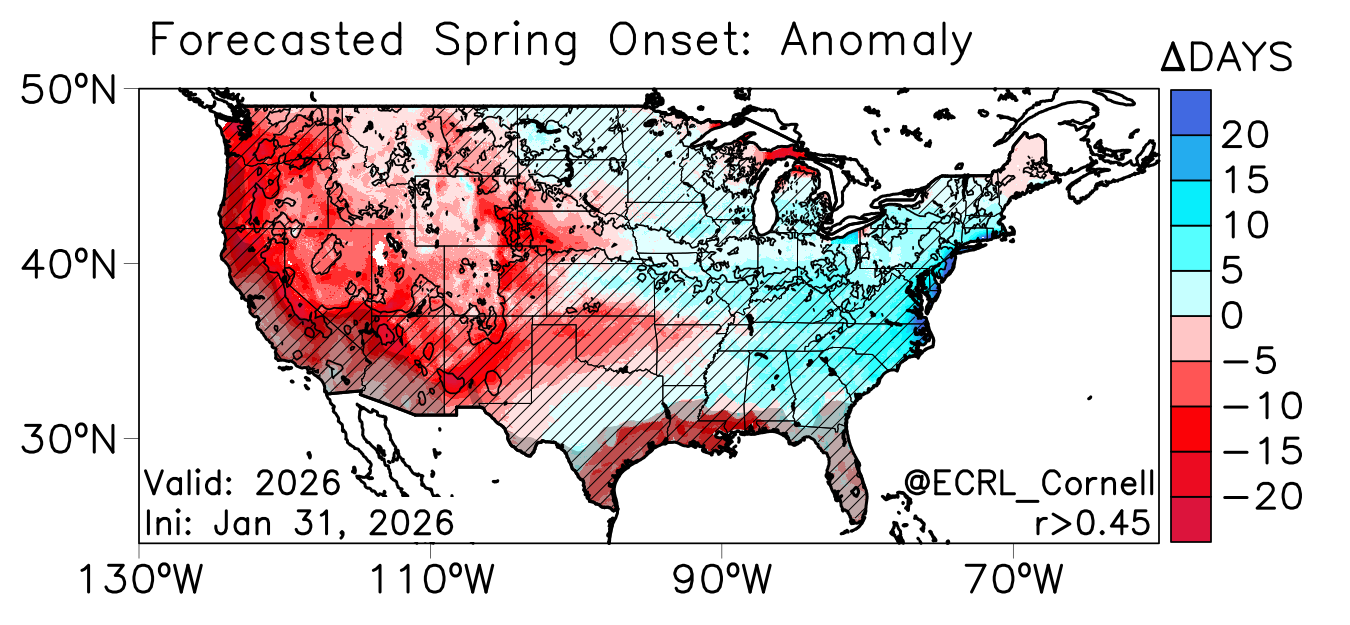
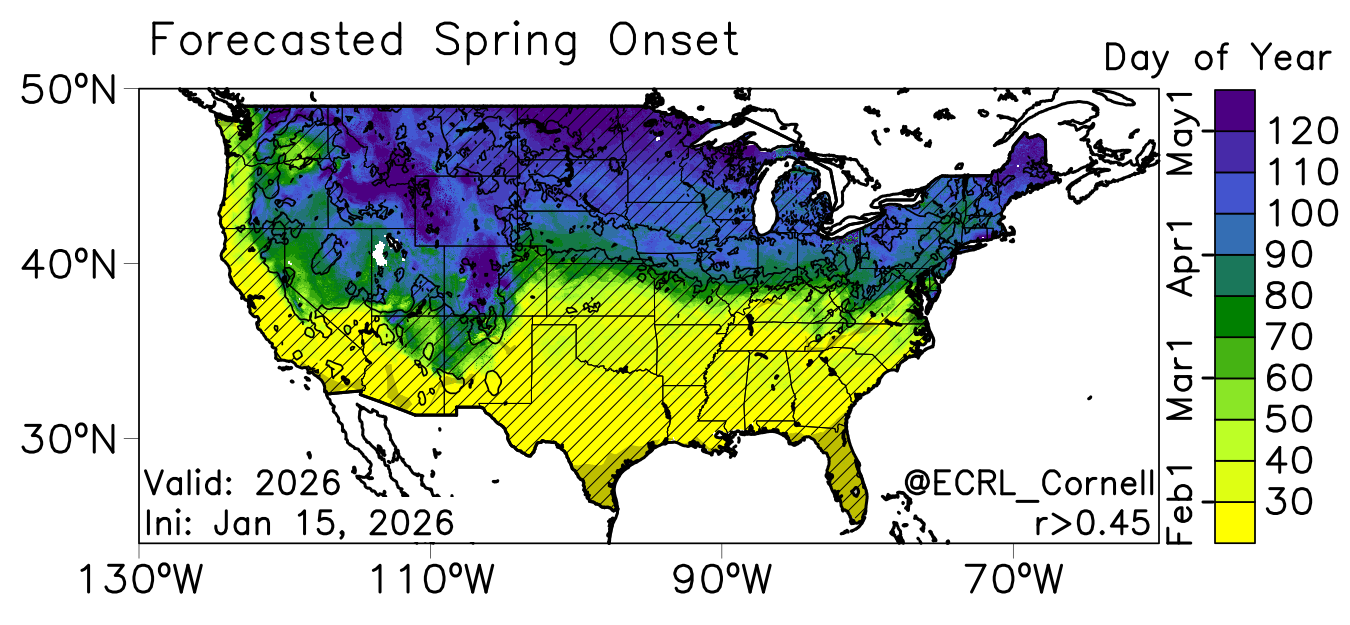
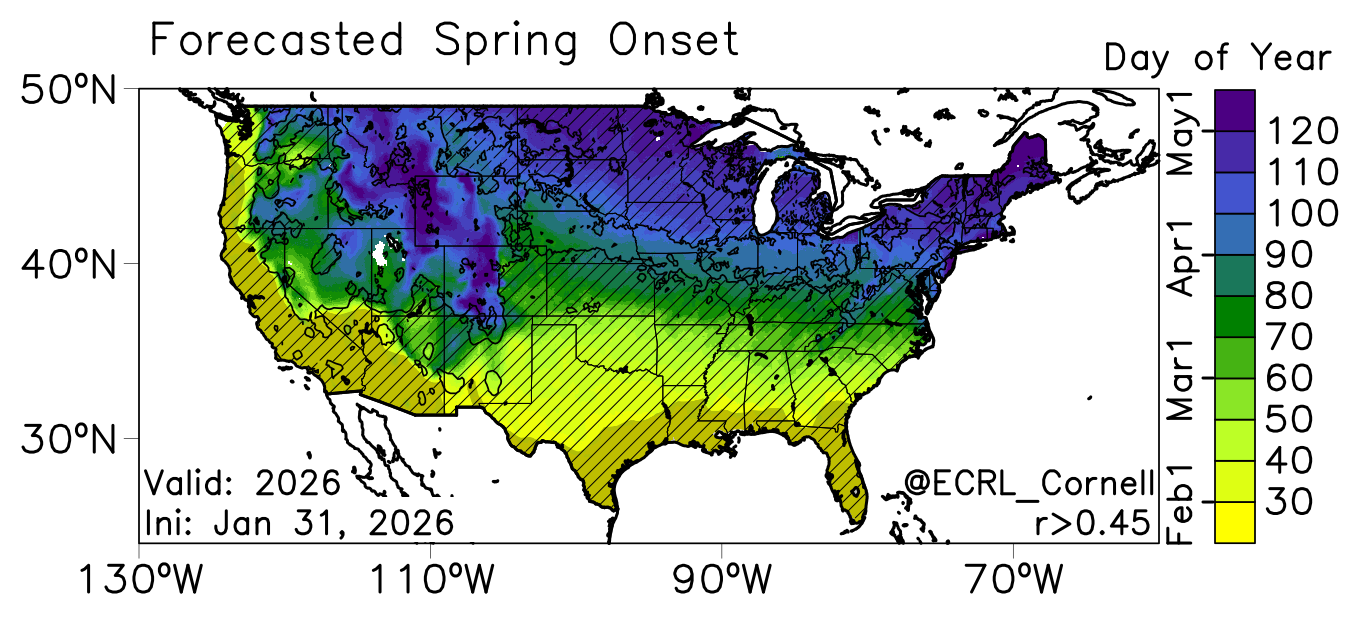
The map above shows the spring onset forecasting (ΔSI-x; spring index anomaly) in units of days. Negative values mean early onset from a climatology defined for 1982-2010 and positive values for late-onset. The black solid lines indicate the forecasting skill (local skill), e.g., validated regions where the spring onset has correlation thresholds of r > 0.45. Also, the gray shaded zones are regions where the spring onset (SI-x) has occurred.
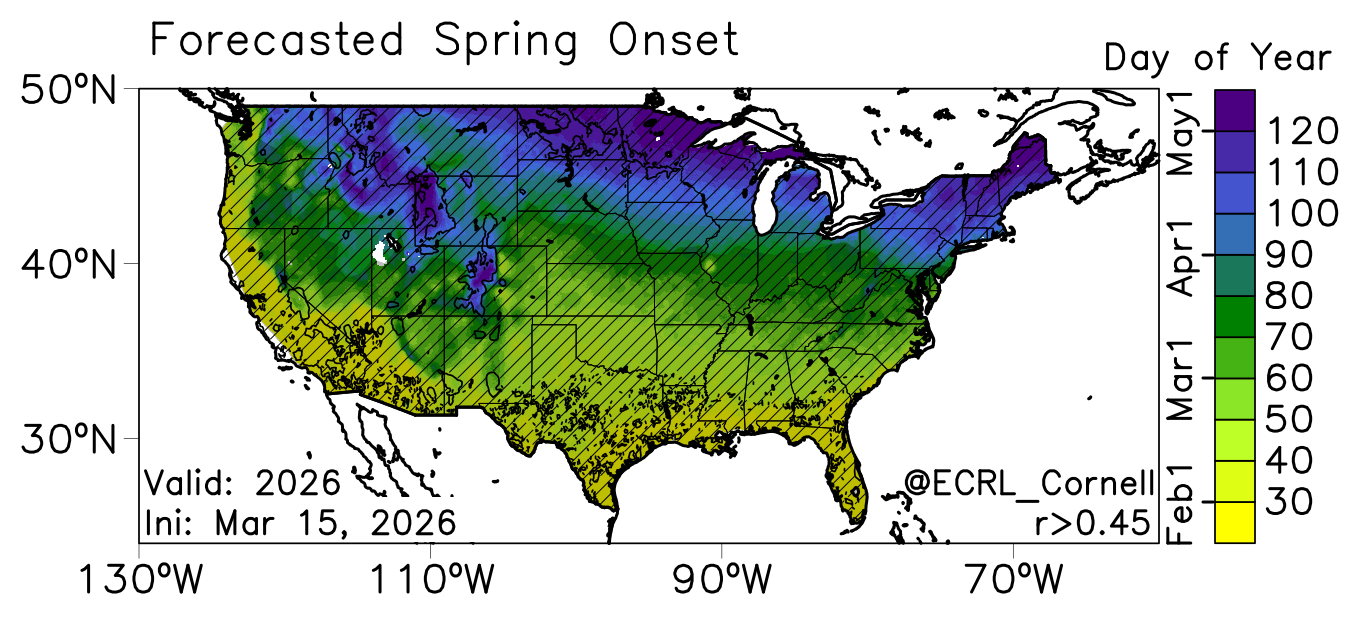
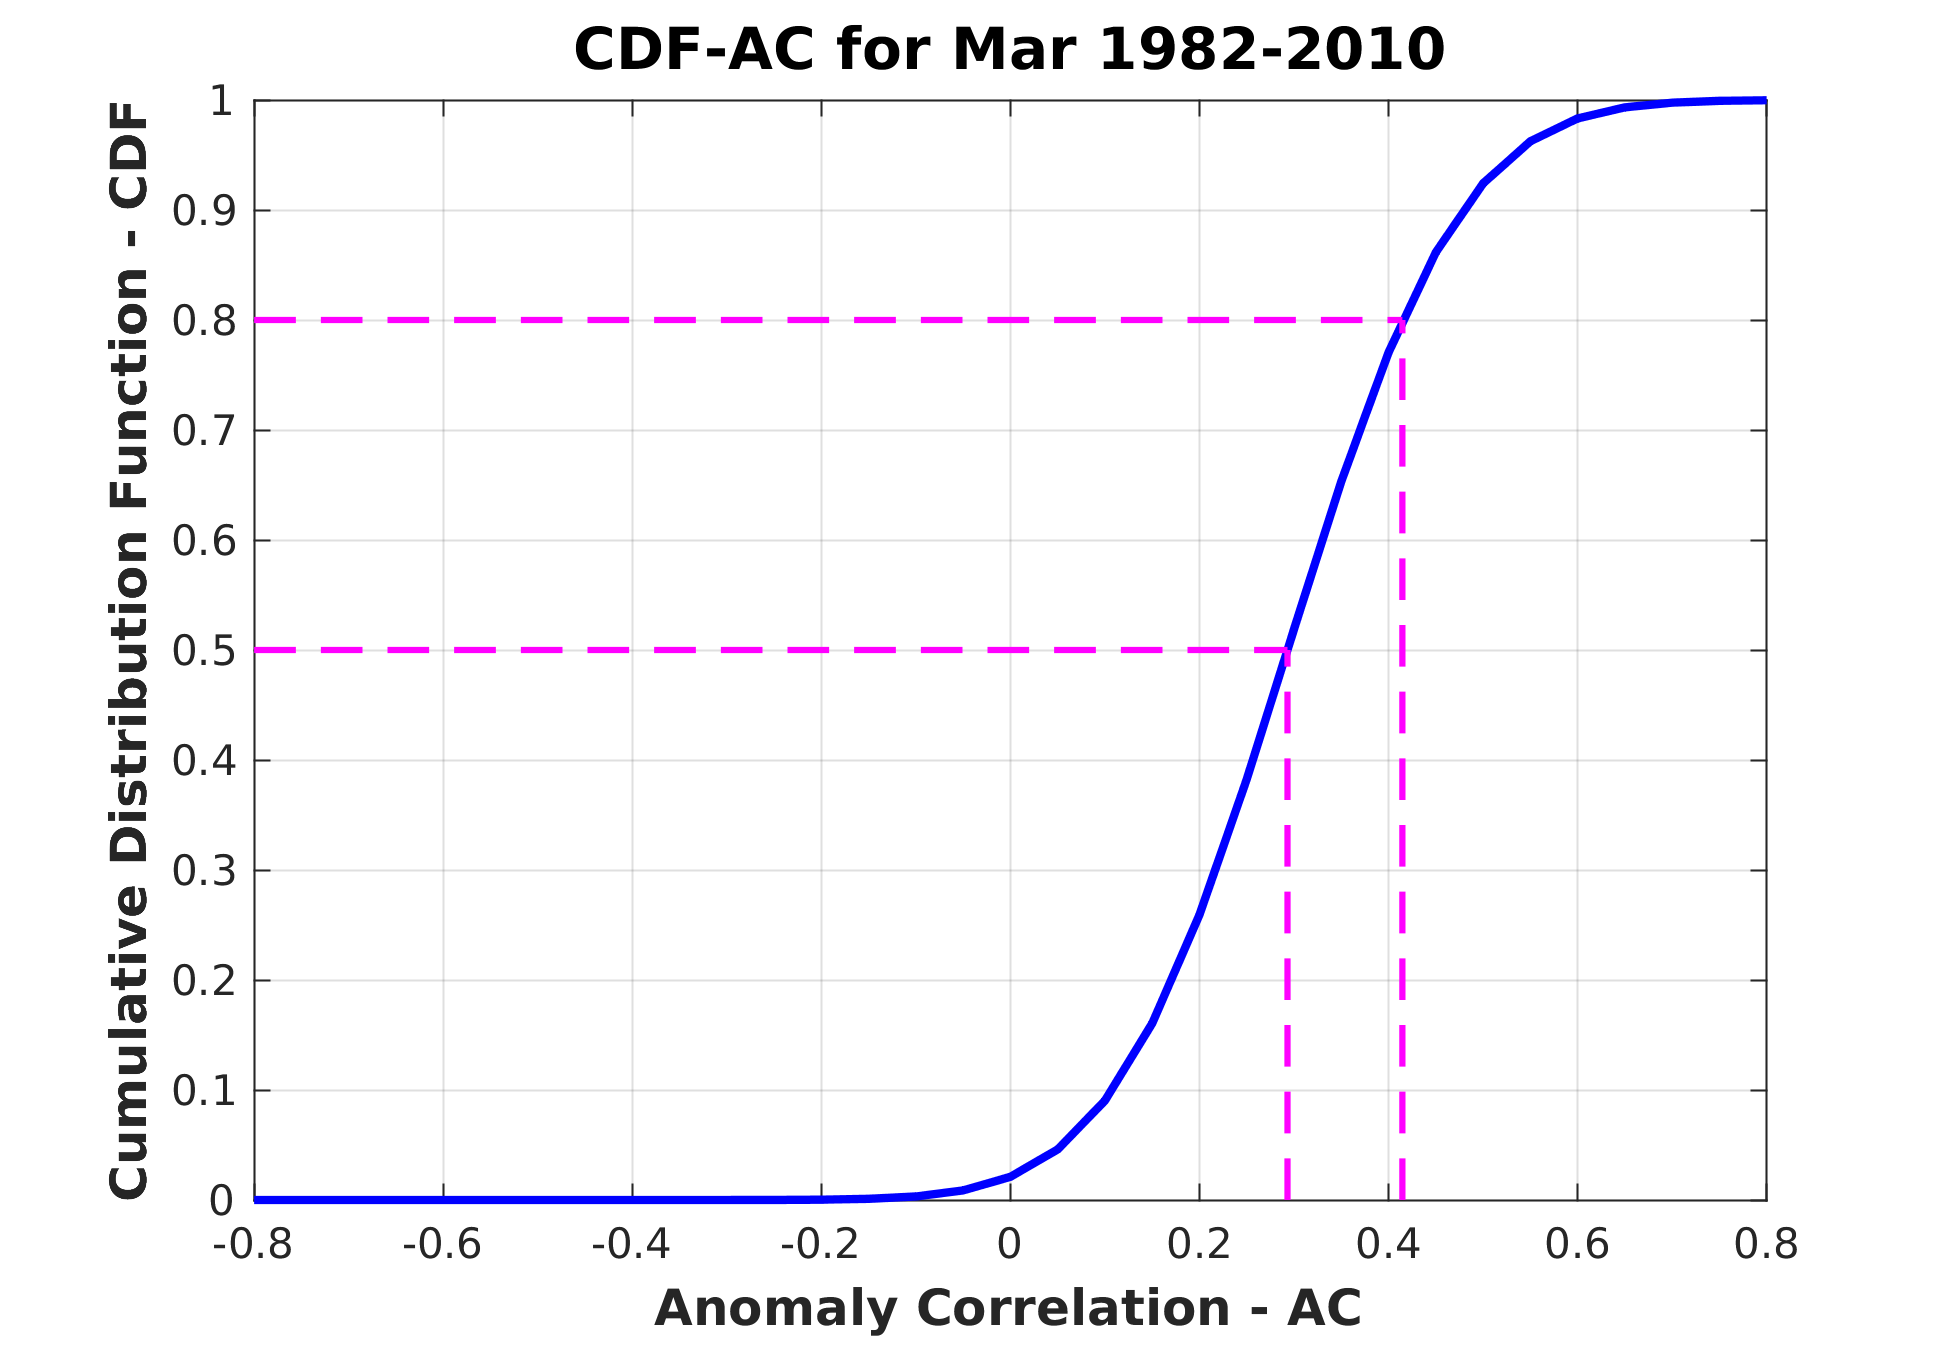
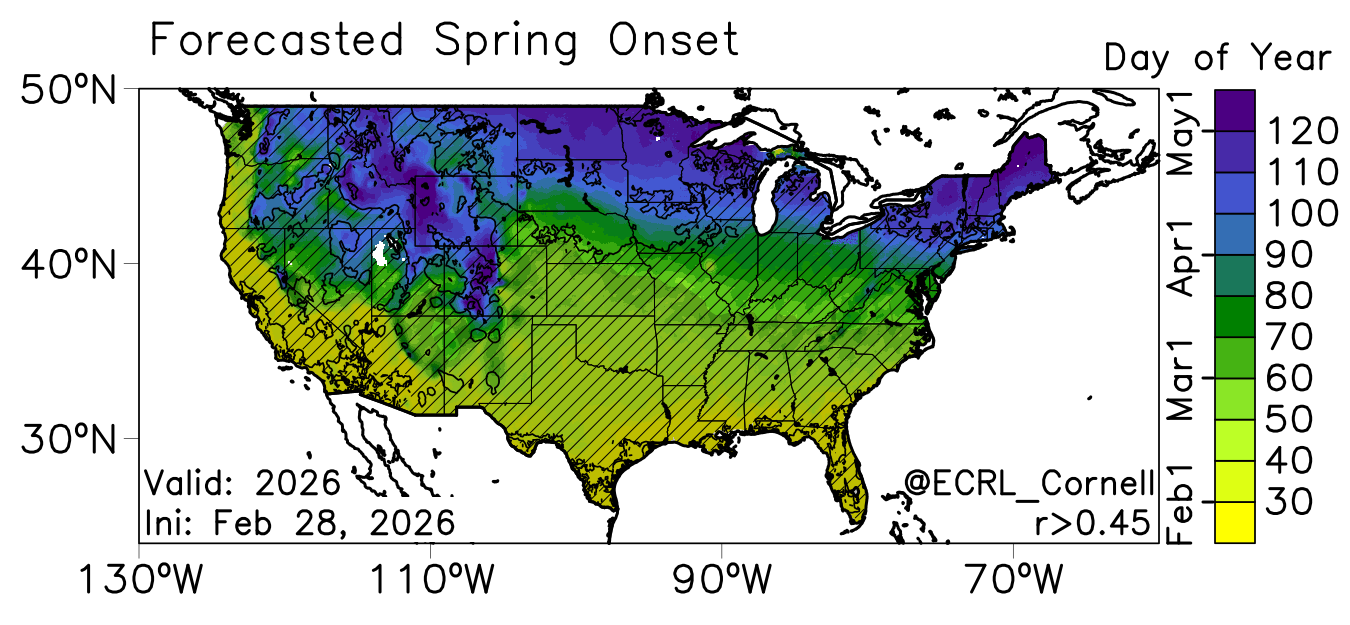
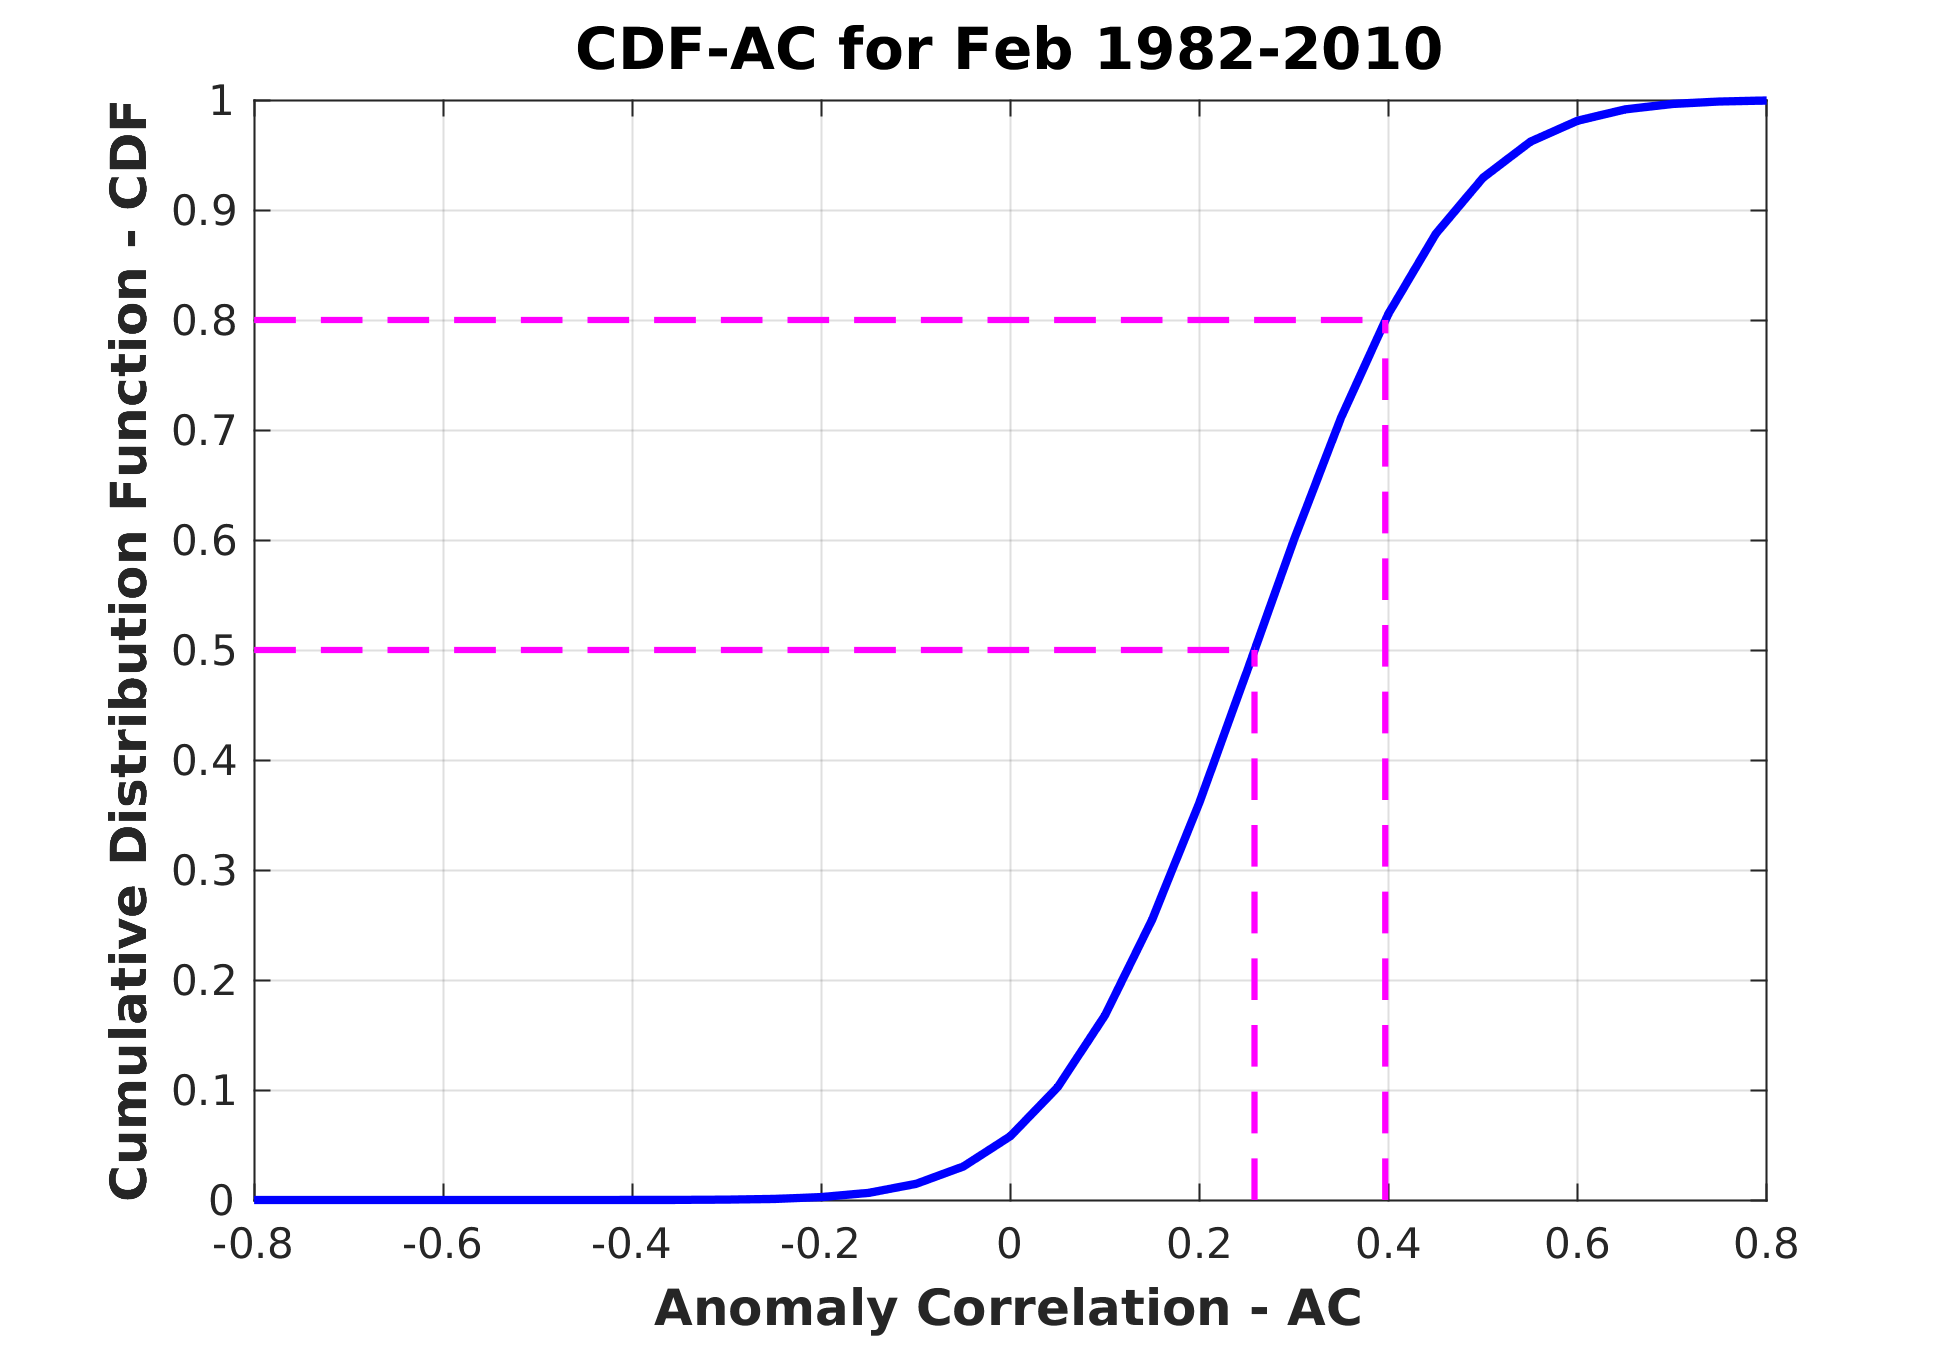
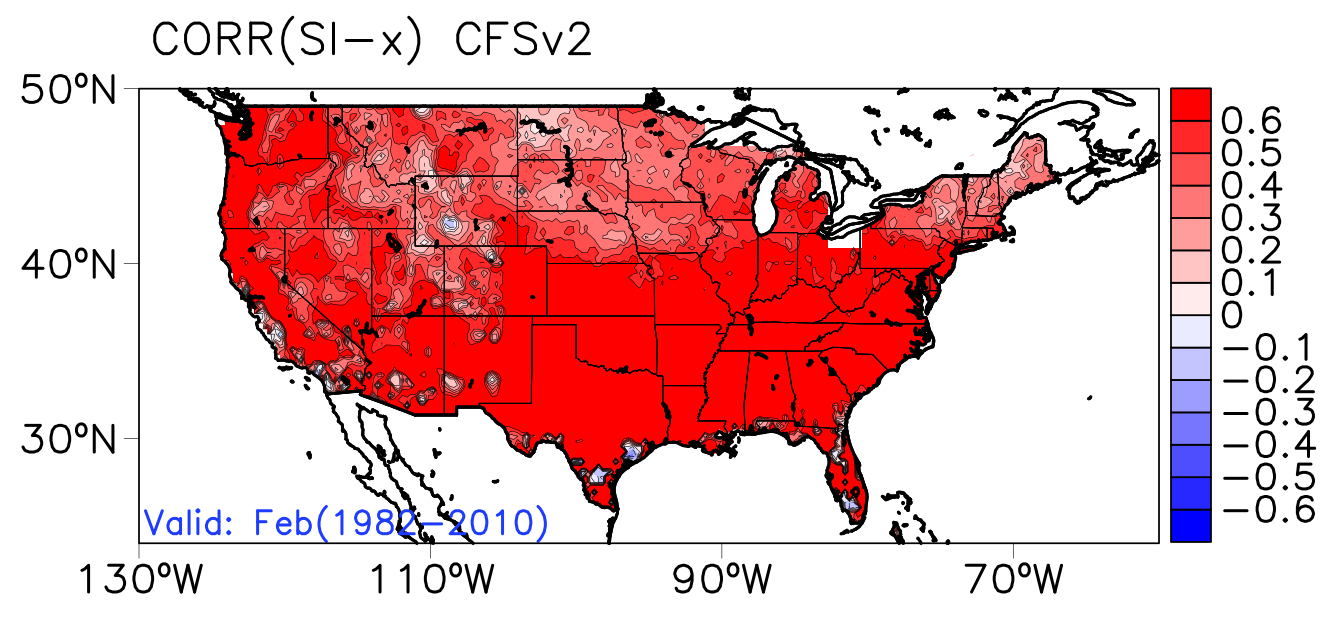
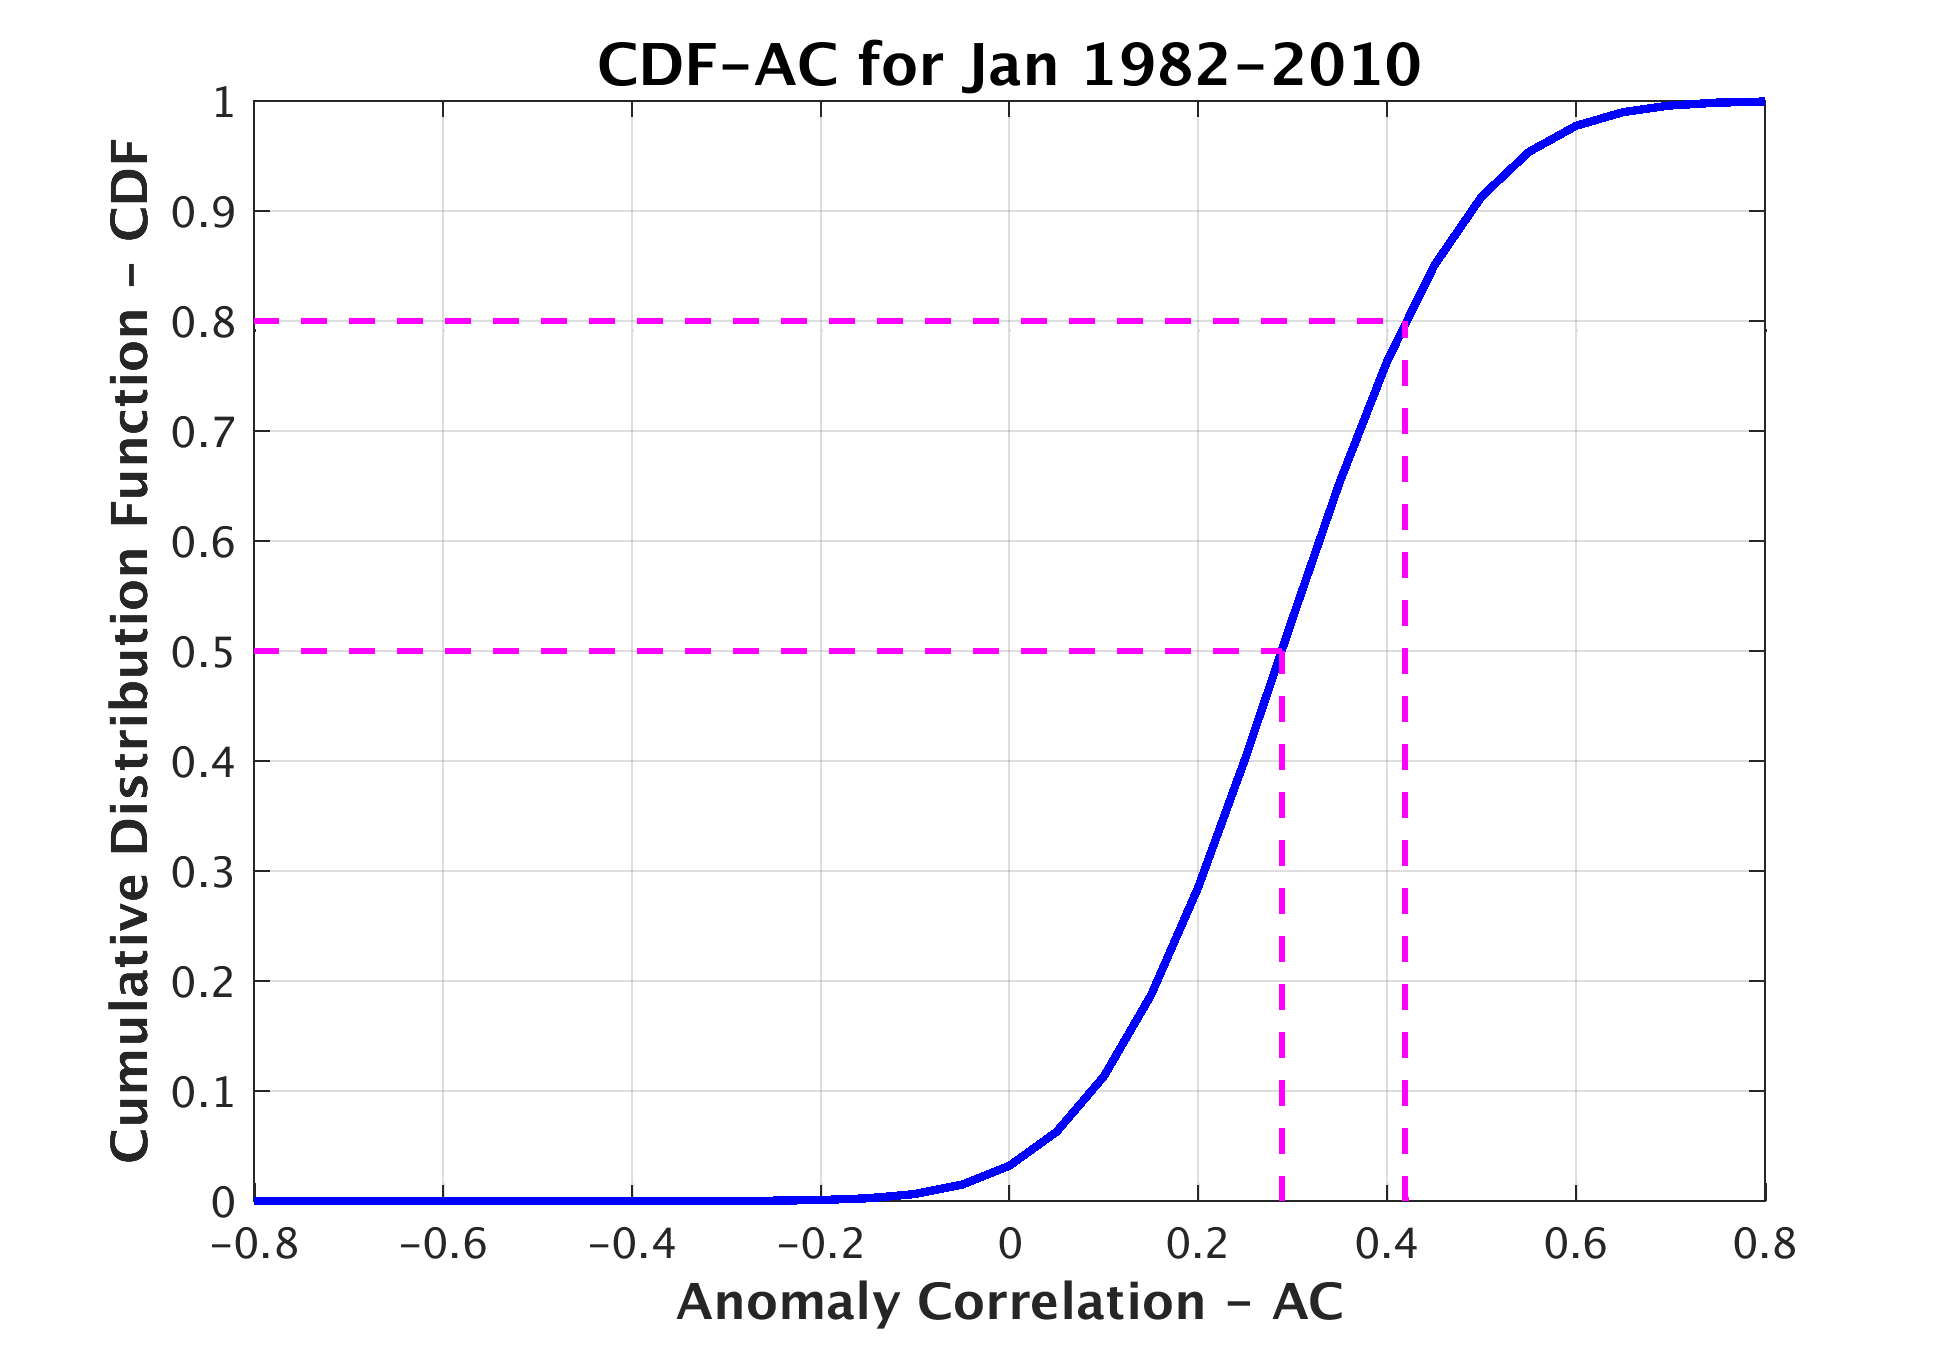
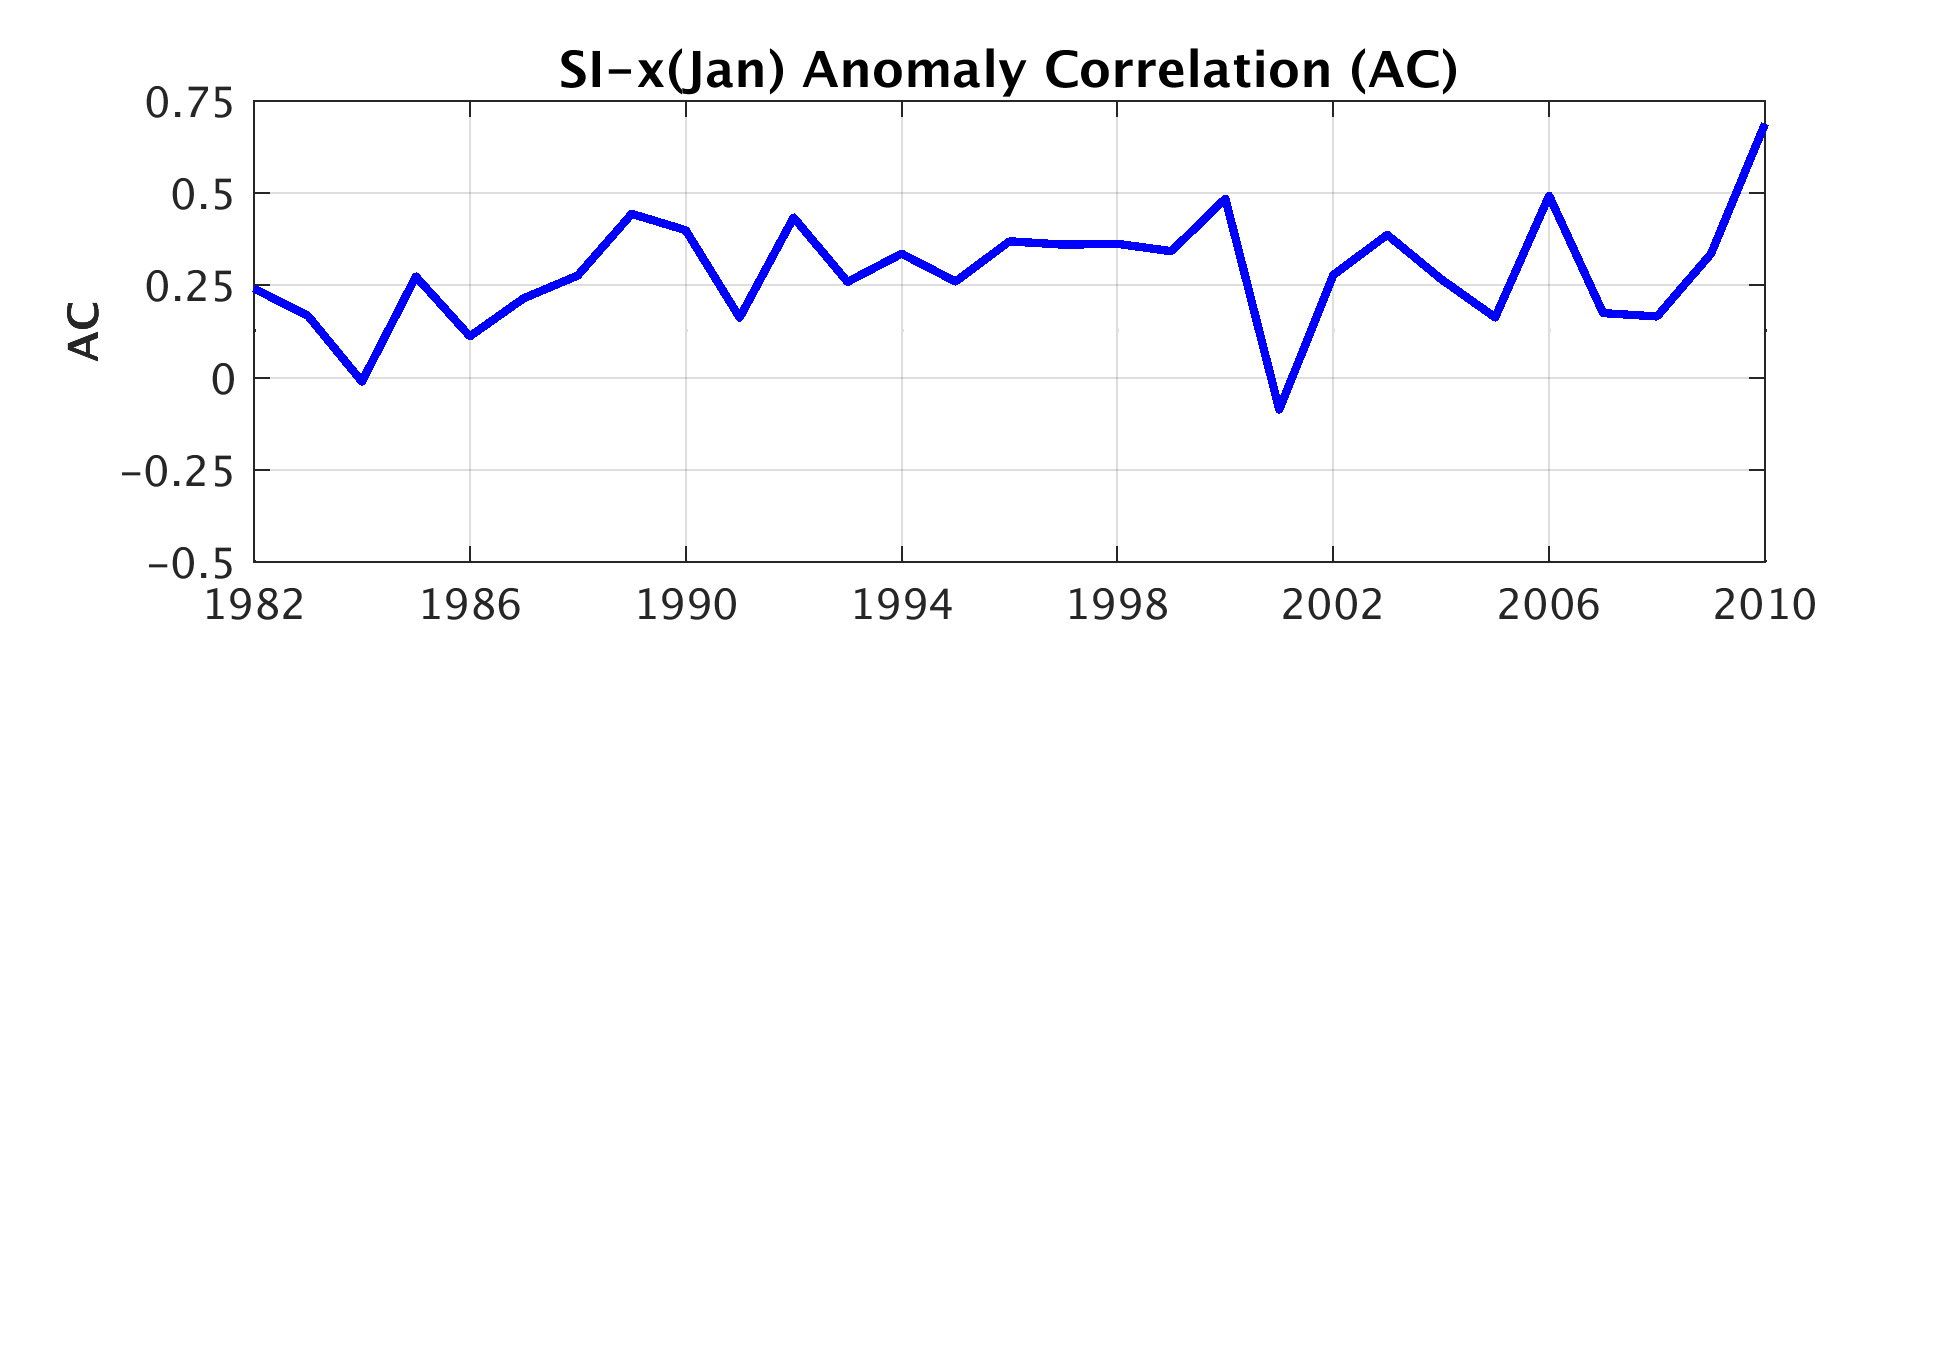
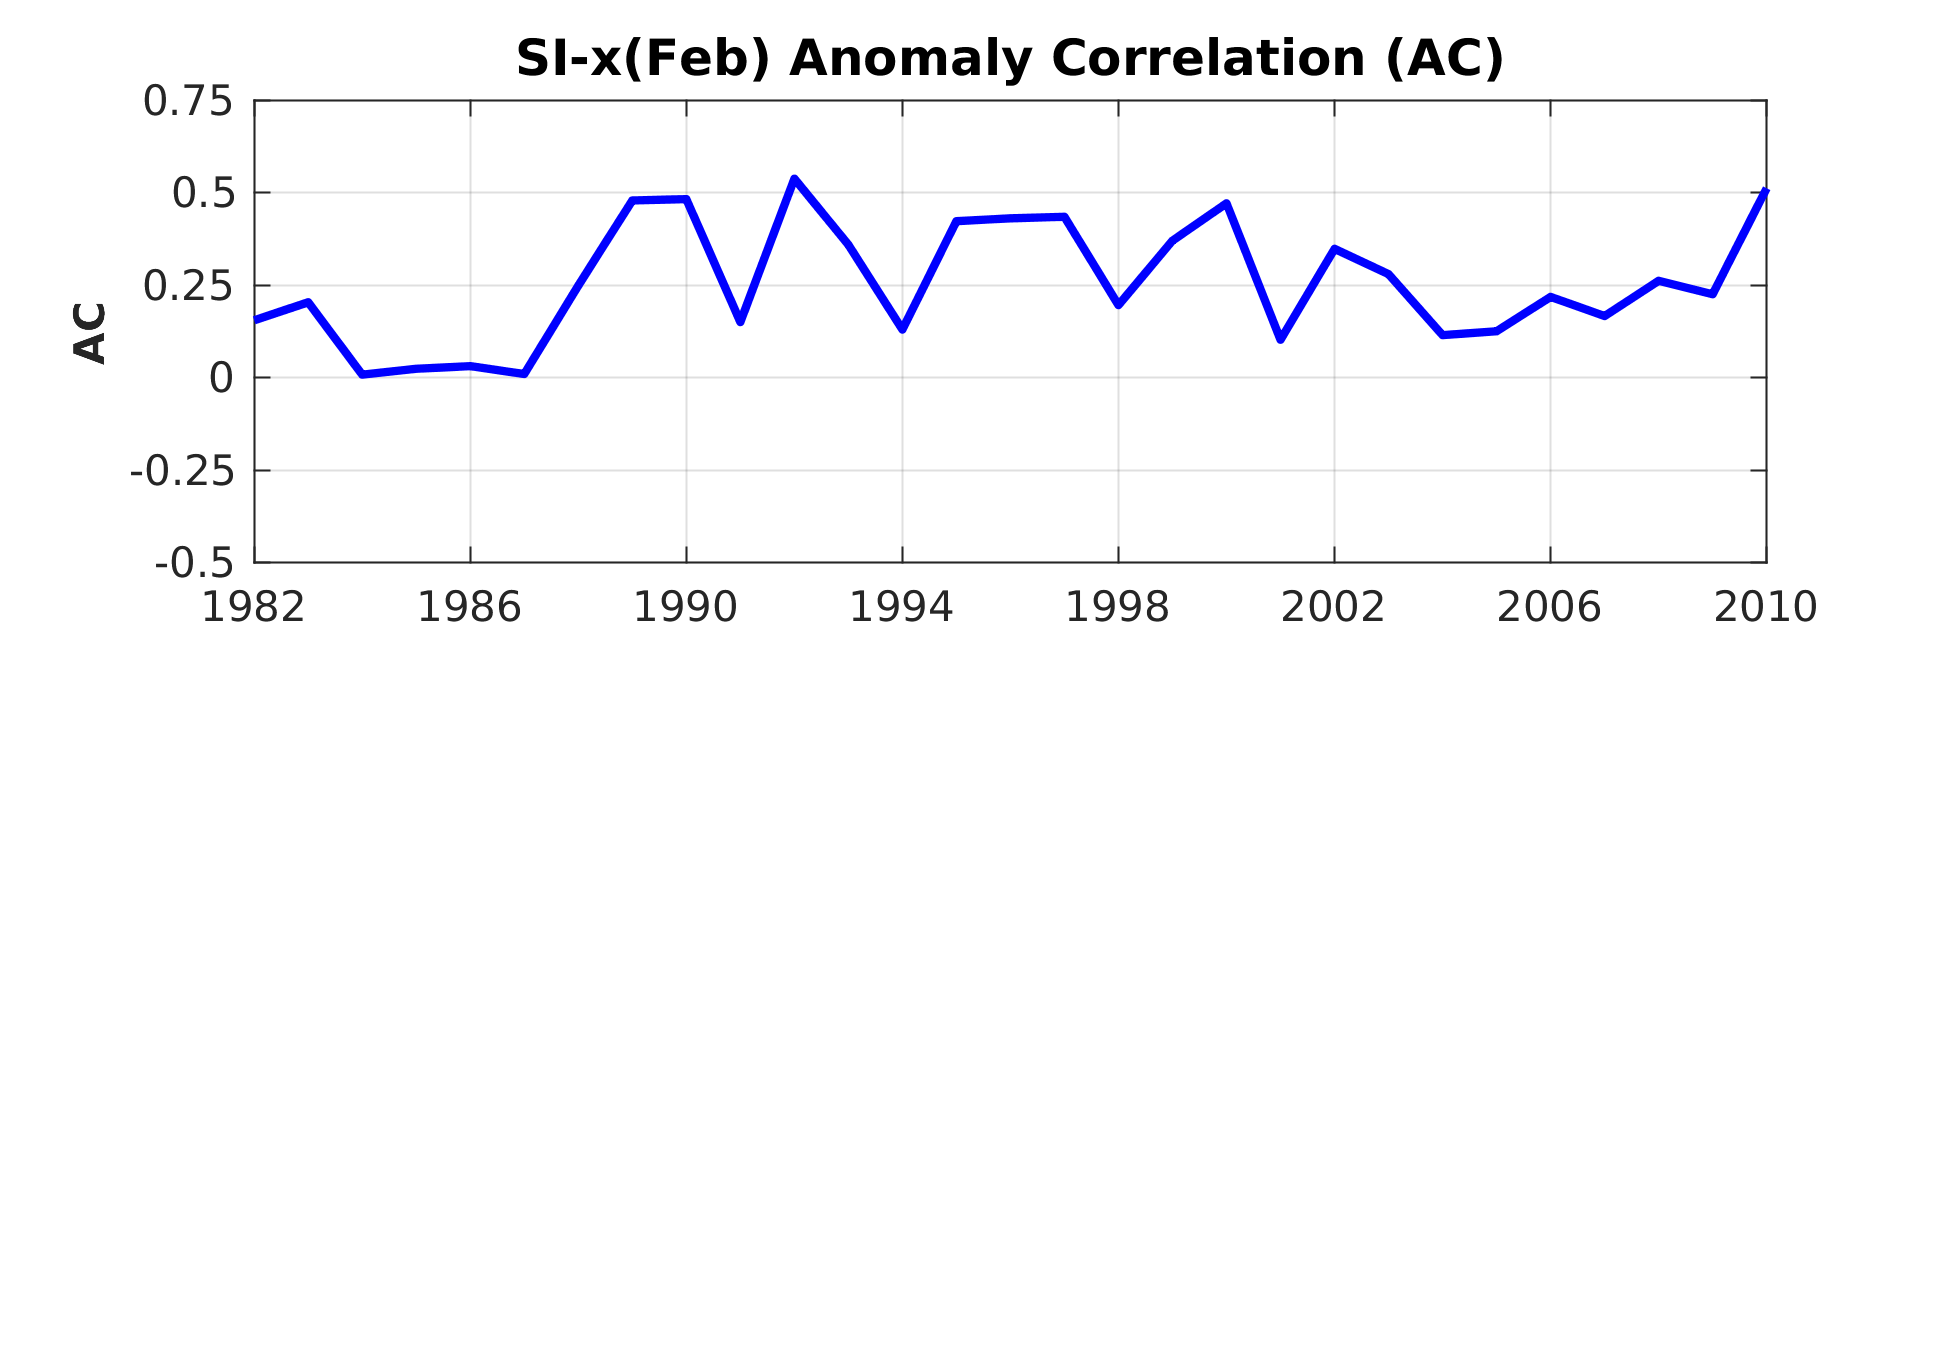
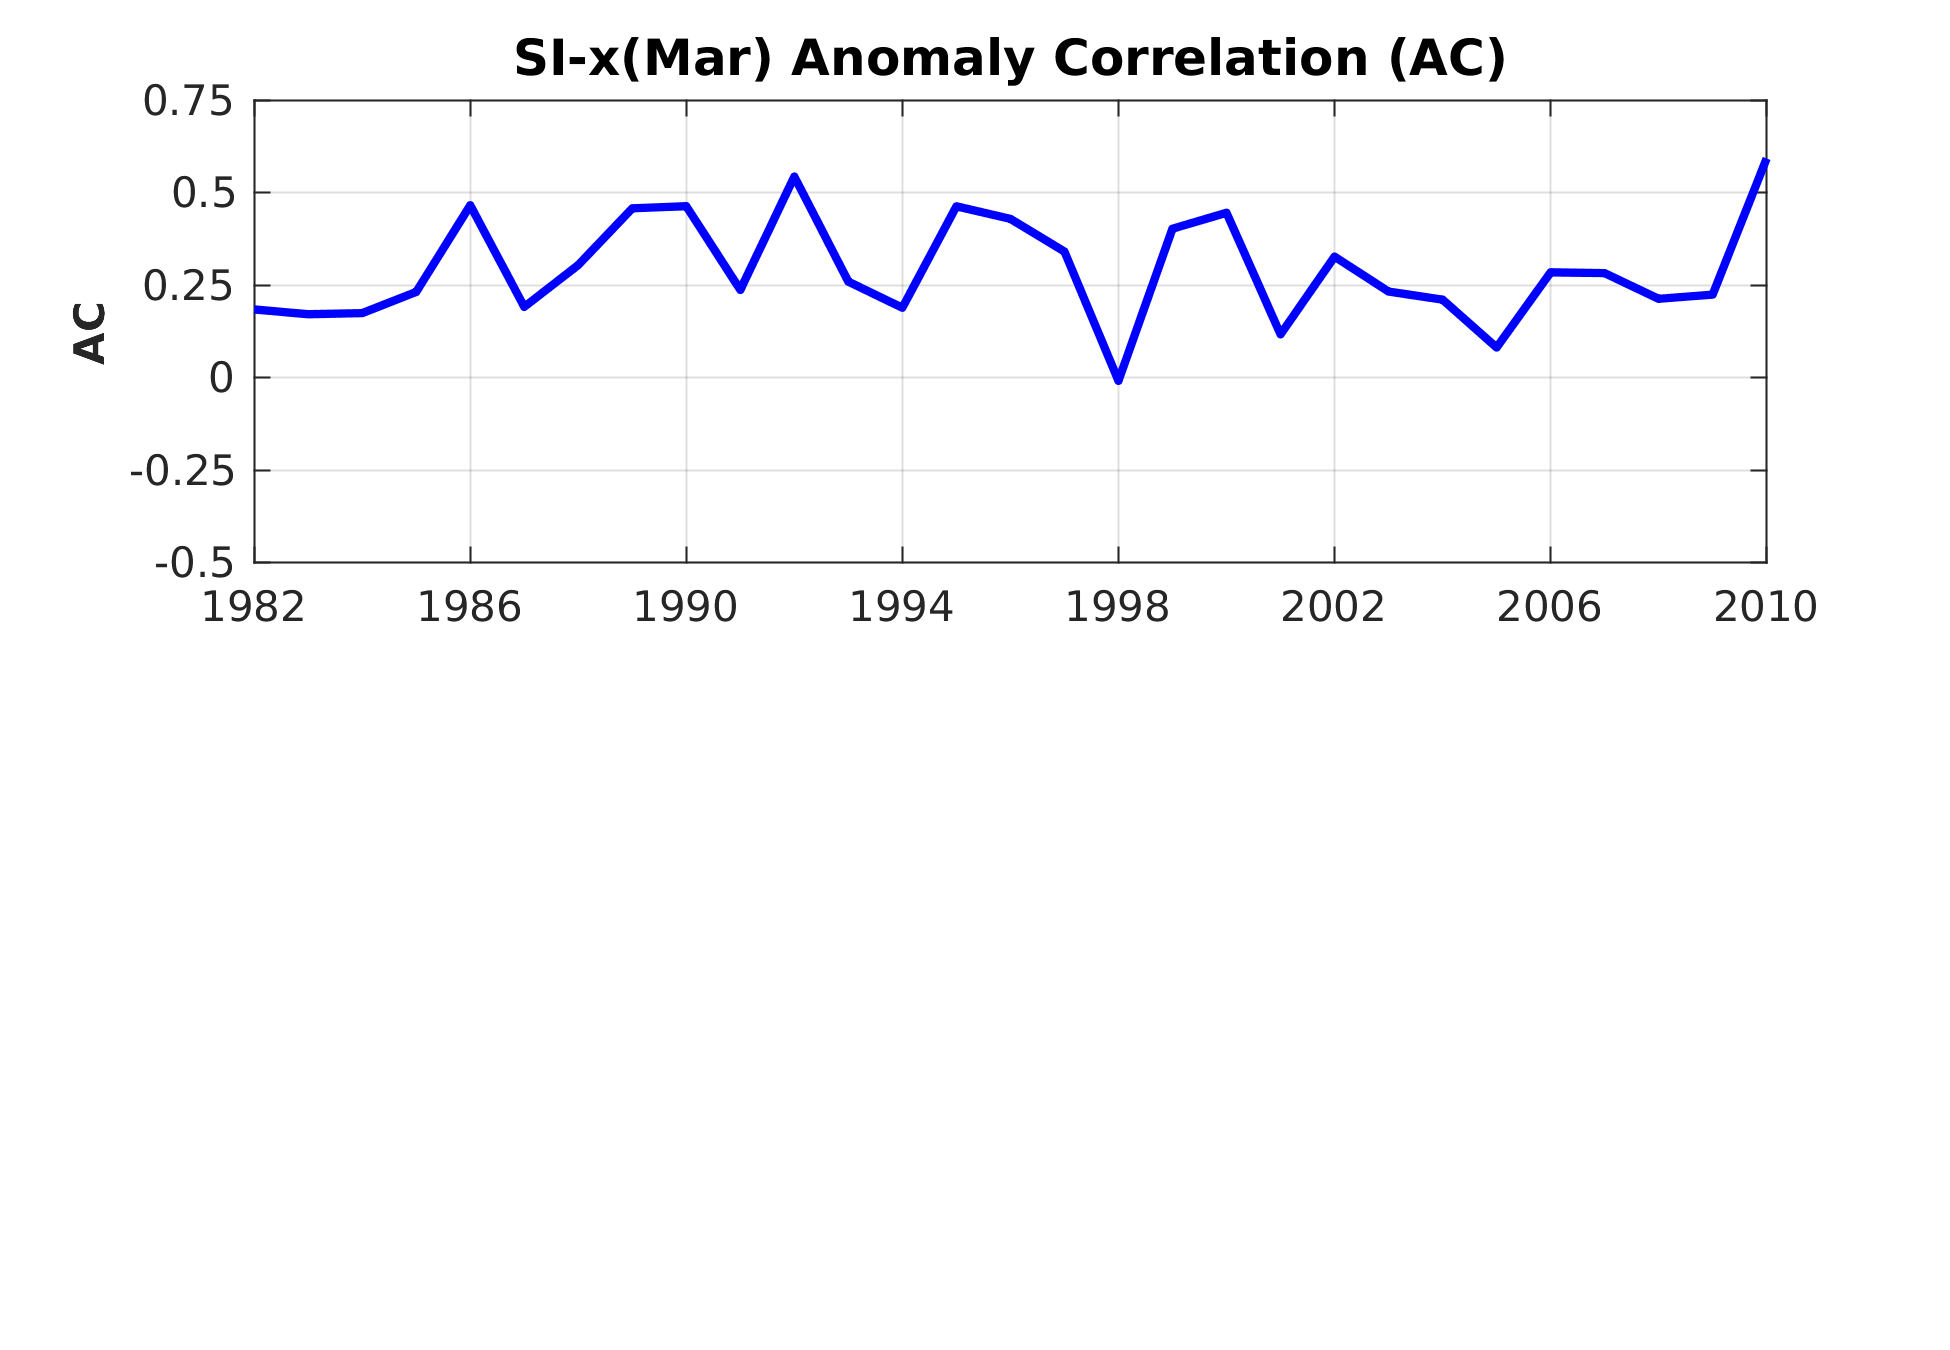
The actual forecasted day of the spring onset (SI-x) is indicated in the table below in calendar days (Day-Of-the-Year units, DOY). This table describes four products related to the SI-x forecast for different initializations (e.g., Jan 15, Jan 31, etc.). Four fields in the table are updated monthly: (1) the Spring Index anomaly (ΔSI-x); (2) the Spring Index (SI-x); (3) a Global Skill defined as CDF of centered anomaly correlation for the entire domain (Wilks, 2011); with two thresholds (0.5 and 0.8) identify skill for different initializations; and (4) a Local Skill defined using Pearson correlation.
Carlos M. Carrillo and Toby R. Ault
Emergent Climate Risk Lab, @ECRL_Cornell
Dept. of Earth & Atmos. Sciences, Cornell University
| ∆SI-x | SI-x | Mar | 15th | 31th | 15th | 31th | Global_Skill | Local_Skill | Feb | 15th | 28th | 15th | 28th | Global_Skill | Local_Skill | Jan | 15th | 31th | 15th | 31th | Global_Skill | Local_Skill |
| Jan | time_series | Global_Skill | Local_Skill | Feb | time_series | Global_Skill | Local_Skill | Mar | time_series | Global_Skill | Local_Skill |